
Live Data Publishing
Ingest anything.
Publish everywhere.
Maintain nothing.
Our orchestrated compute layer ingests data, transforms it through a staged pipeline, and publishes analysis-ready dashboards to GitHub Pages, S3, your website or database - on a schedule, with nothing to maintain.
Publishing live data usually forces a bad trade-off
The Problem
Buy a SaaS platform
Tableau, Power BI, and Domo are expensive, inflexible - they lock your data into their platform, and block your users from exploring your data.
The Problem
Build it in-house
Hire a data team. Costly to staff, and fragile the moment the one person who understands it leaves.
What Nimble Does
Automate it end-to-end
Self-updating, self-maintaining, interactive, mobile-friendly, low-cost. Live in days, not weeks.
Ingest
Pull from any source, database, HTTPS endpoint, or API on a schedule.
Raw (L0)
Immutable, checksummed source of truth. Signed and timestamped.
Micro-reports (L1)
Organized by every dimension at once - pivoted, redundant by design.
Summary (L2)
Totals, rankings, and trends aggregated and ready to render.
Interactive App
Mobile-friendly, sub-second response, ready to explore.
The Nimble Data Pipeline
Start with raw, unstructured data - unwrangled — finish with curated user experience that turns noise into decision intelligence.
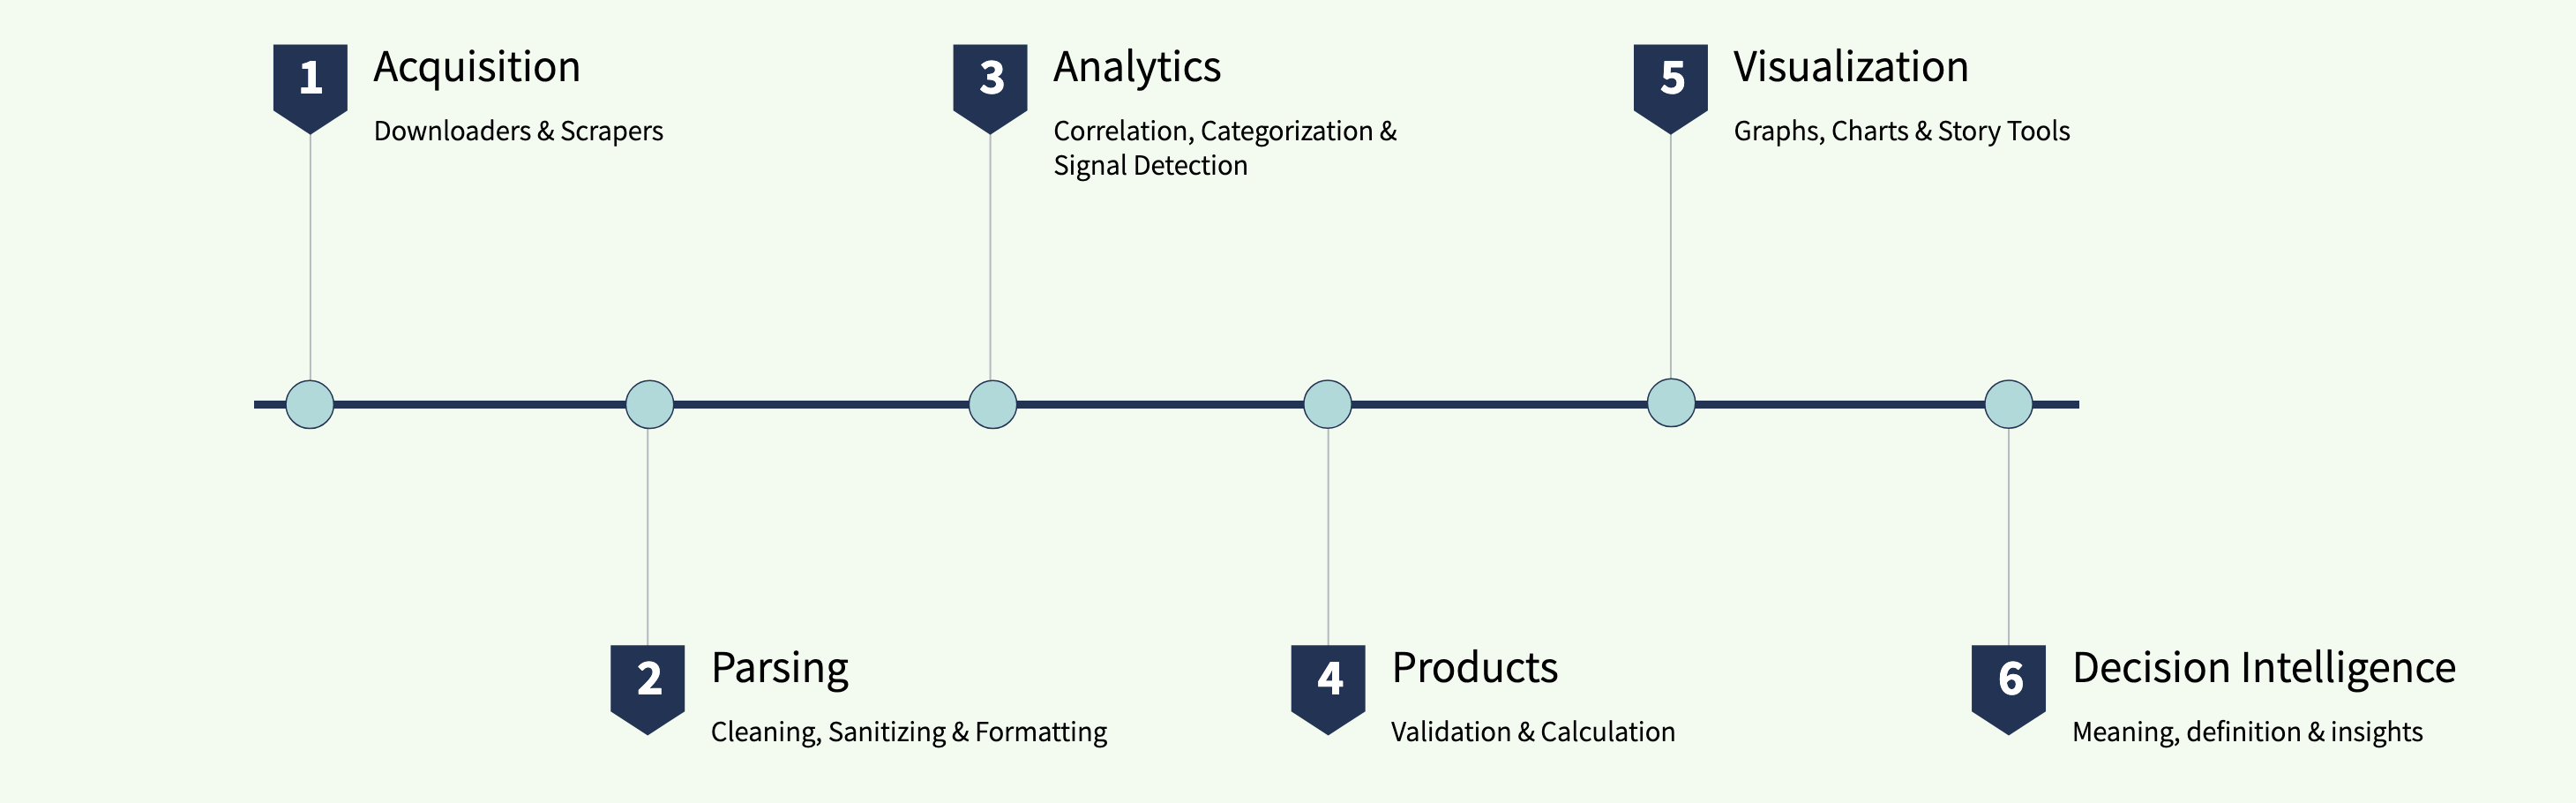
Scheduled, orchestrated scrapers, form submitters, API integrations, and streaming receivers pull data from its source — built to scale.
Wrangle raw data into a consistent, discoverable shapes - cleaned, sanitized, and formatted for usability and consumption, without manual intervention.
Automated data introspection that correlates, categorizes, and separates signal from noise - distilling comprehension and nuance that's important to the business objective.
Findings broken into small, purpose-built micro-reports that feed the visualization layer with exactly what matters and nothing extra.
Automated business-intelligence visuals, tuned and pivoted to make patterns and anomalies obvious at a glance - no analyst required, no data scientist needed.
Charts, graphs, and infographics are packaged to be shared, permalinked for reference - designed to answer, Why? What? So what? and What now?
Every record is pre-organized into every view it could ever be needed in. Click any entity, anywhere on the dashboard, and get a sub-second answer - with no backend, no database, and no API gateway to run.
AI Enbablement & Data Readiness
Don't just point AI at your data and call it a day. Raw access isn't readiness - an AI model reasoning over unstructured, unpermissioned data is exactly how you get hallucinations, leaked context, compliance violations and answers you can't trust.
Nimble's staged pipeline does the work of structuring, isolating, and permissioning your data first, so prompt engineering, knowledge bases, and agentic AI have something worth reasoning over — and every answer stays as auditable as the data it came from.

|

|

|

|
|
| Prompt Engineering | Knowledge Bases | Agentic AI | AI Guardrails | |
|---|---|---|---|---|
| Purpose | Augment model capability with contextual data - passed securely, in a prompt with changing guardrails | Augment Models with static data to enhance LLM prompts and responses | Augment models with dynamic data and iterate autonomously on conversations and context | Pre and post prompt permission and santity checking protecting sensitive data inputs and preventing prompt injection attacks |
| Data Need | Contextual information based on user’s query with examples and filters | Contextual information based on user’s query + vector data | Contextual information based on user’s query + vector data + 3rd party API | Real time prompt with context and permission models |
| Data Update Cadence | Frequent, at each prompt | Can be less frequent, when new data is introduced into a knowledge base | Frequent record changes based on agent activity and user interaction | Rolling, real-time permission verification |
GIS Data Insights
Geographic Intelligence
See your data on the map, not just in the table.
Our customized visualization and choropleth mapping solutions allow your organization to align its value proposition with real world location data that matches the localized motivations, preferences and context of your customers.
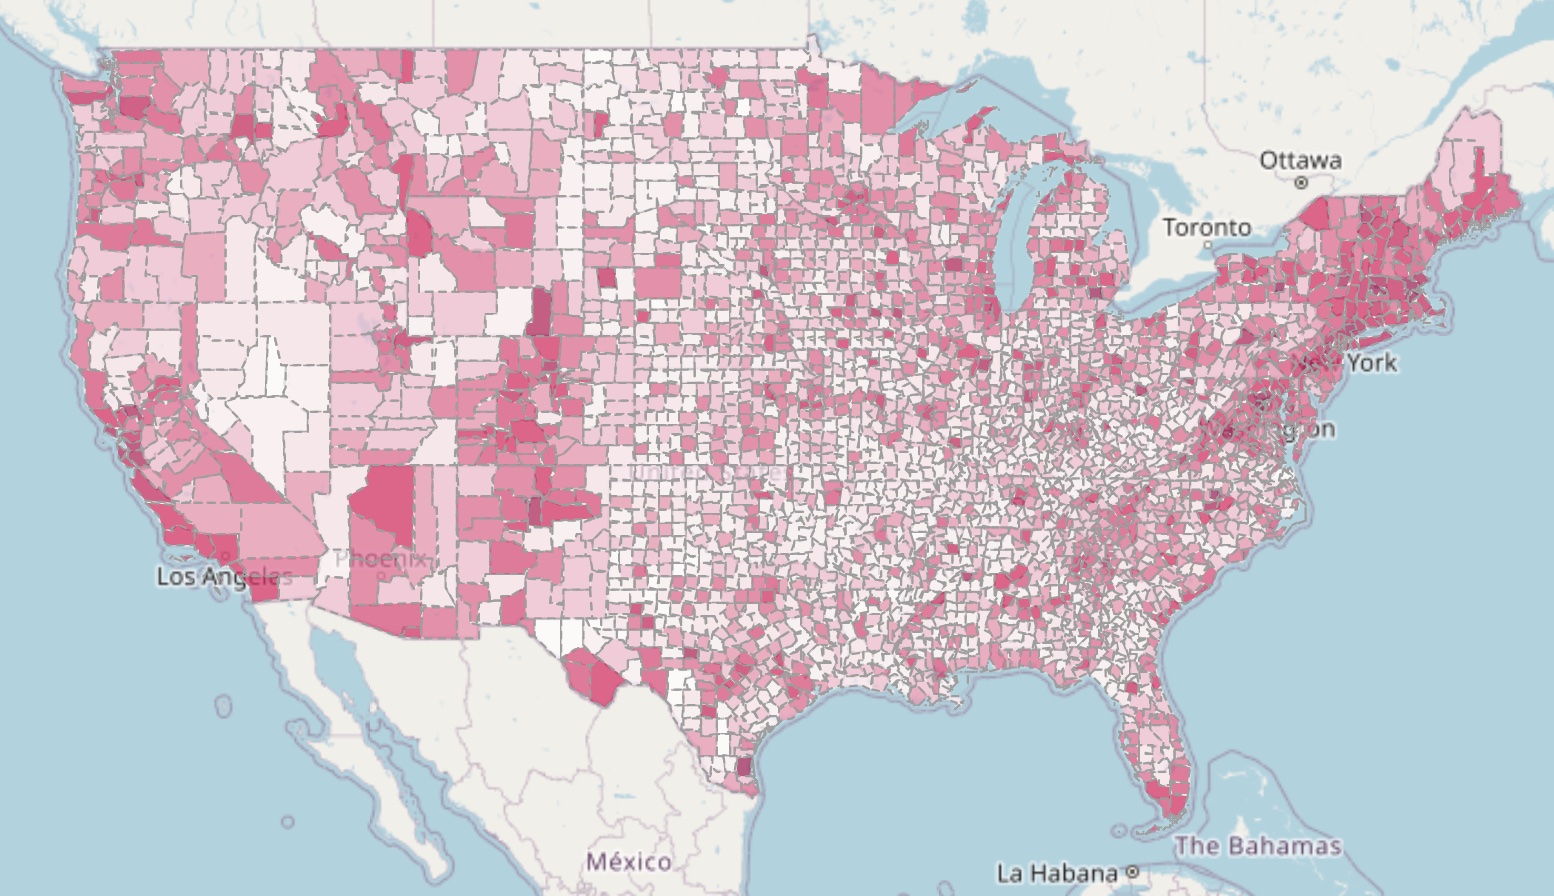
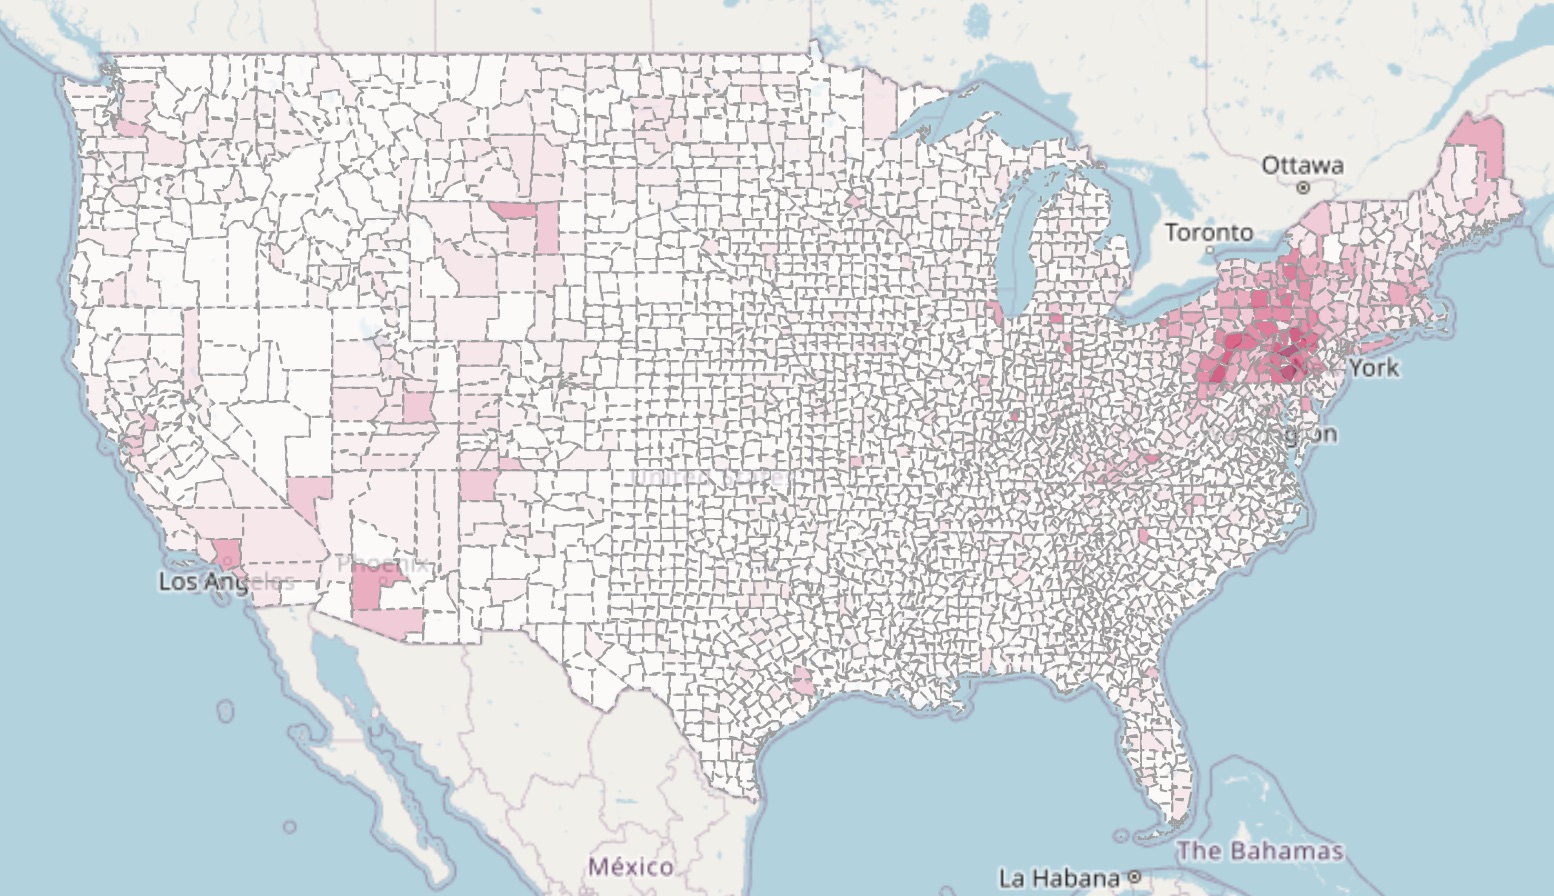
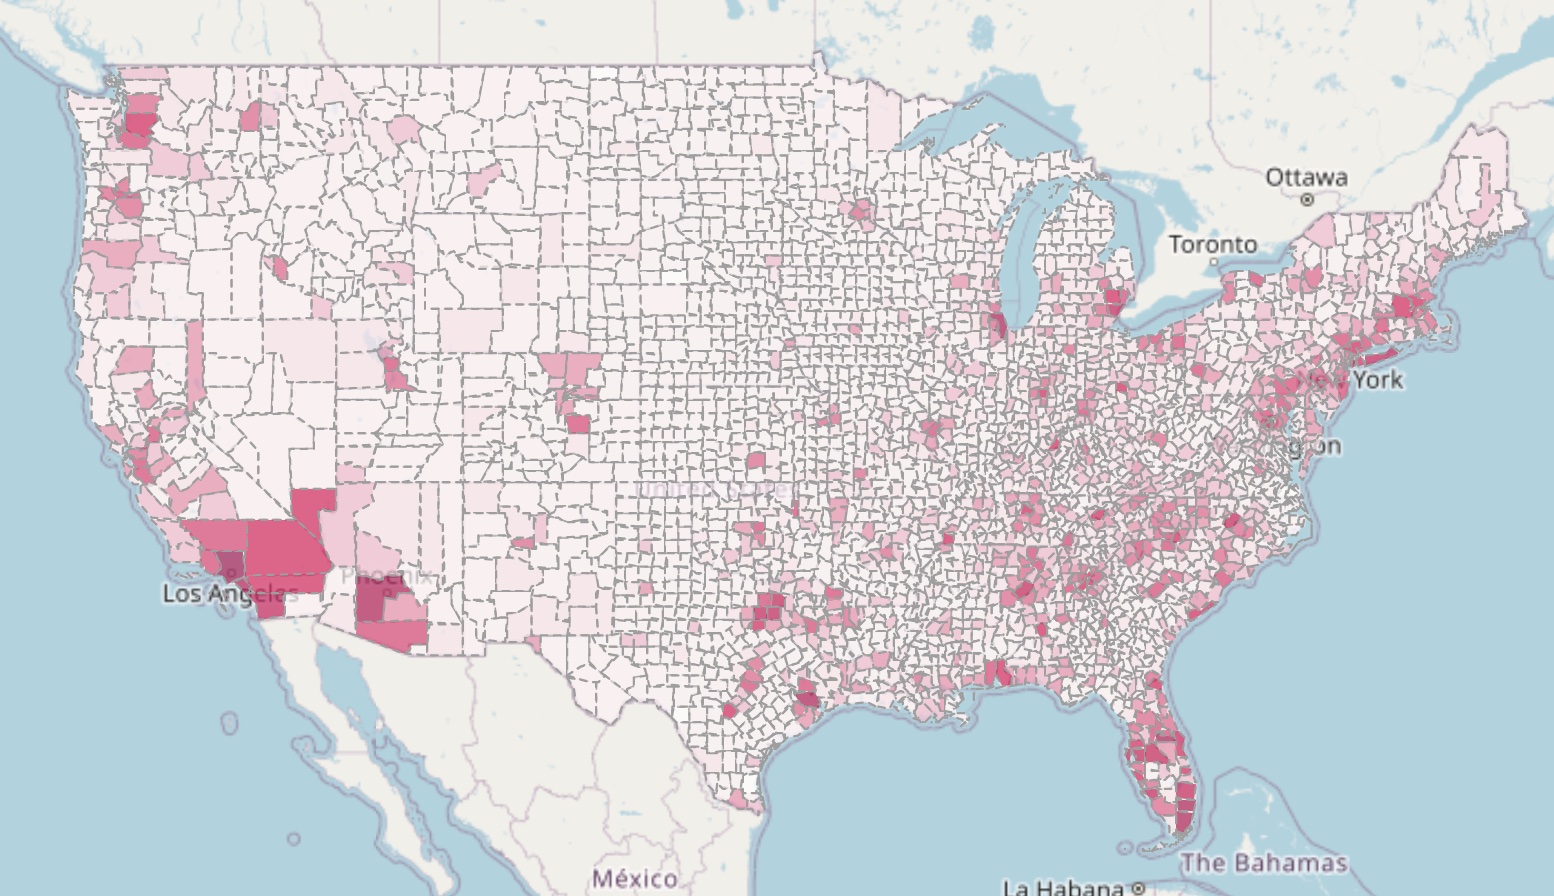
- Choropleth density mapping Surface concentration and intensity patterns by region at a glance, not buried in a spreadsheet.
- Demographic correlation Overlay your data against population, income, and behavioral datasets to find what actually predicts demand.
- Catchment and service-area analysis Understand exactly who you reach today, and where the next opportunity sits.
- Regional anomaly detection Spot outlier markets and underperforming territories before they show up in a quarterly report.
Data & UX
Custom user prompt and system prompt iteration with context tracking and robust guardrails that mitigate hallucinations and leakage.
Vendor agnostic plain text JSON, static HTML and PDF output. If you ever walk away, you leave with 100% of your data, imediately usable, with zero migration cost.
Acquisition, parsing, and reporting run in a defined order, on a schedule, hands-off - and pick back up automatically if a step fails.
Commit to GitHub, push to S3, or write to your own database or website - all from a single scheduled run.
Infrastructure cost is disclosed and scales with your cadence and data volume - not with headcount or seats.
Every source is parsed for the dimensions that reveal real structure, with outliers and unnamed patterns isolated so they never distort a ranking, making the story obvious to the reader.
Intuitive drill-down navigation, designed to feel instant on any device, at every click.
Coordinated control across your public and private GitHub repositories, enabling gated, controlled access from one pipeline.
See the live demo

Keystone Ledger Lens gives instant access to Pennsylvania's verified public spending data; designed for non-technical audiences, helping citizen journalists, economic analysts and policy makers
Enabling researchers and analysts to observe spending patterns, vendor concentrations, and fiscal trends across multiple years of state payment history, making it easier to detect fraud, waste and abuse.
Daily acquisition of raw PA Treasury checkbook data; normalized and formatted; and displayed by our lightweight high-performance visualization layer built for non-technical users. No SQL, no data science degree required.
From raw, unstructured to normalized, sourced, queryable - so AI has something real to reason over
